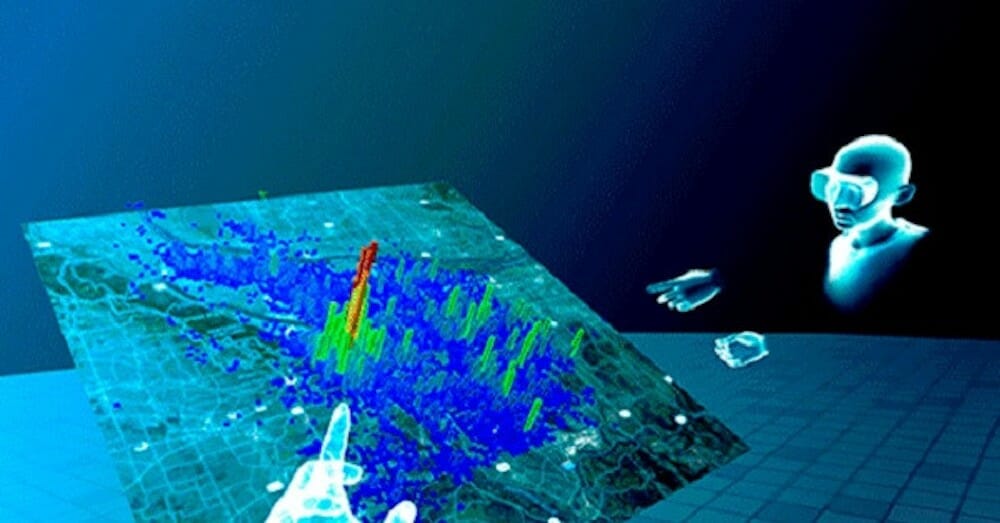
When we think of how we visualize data, we generally think of the usual suspects: pie charts, scatter plots, histograms, bar graphs, and more. Data science has tremendously raised the quality of visualizations, offering a broad spectrum of charts to present data – including line histograms to illustrate the distribution of many data points for a single variable, and a waterfall chart to show static composition. In fact, we’ve now moved to 3D data visualization, with researchers now able to visualize seismic activities occurring within the earth.
But soon, these modes of visualizing data will no longer be enough. Data science projects today include several hundred variables from sources both structured and unstructured, and to visualize this data, something more than 2D charts or 3D graphs will be required. This is where Virtual Reality comes in.
Bring VR training to your organization and start a free trial of Viar360 today!
What is Virtual Reality and how does it help with data visualization?
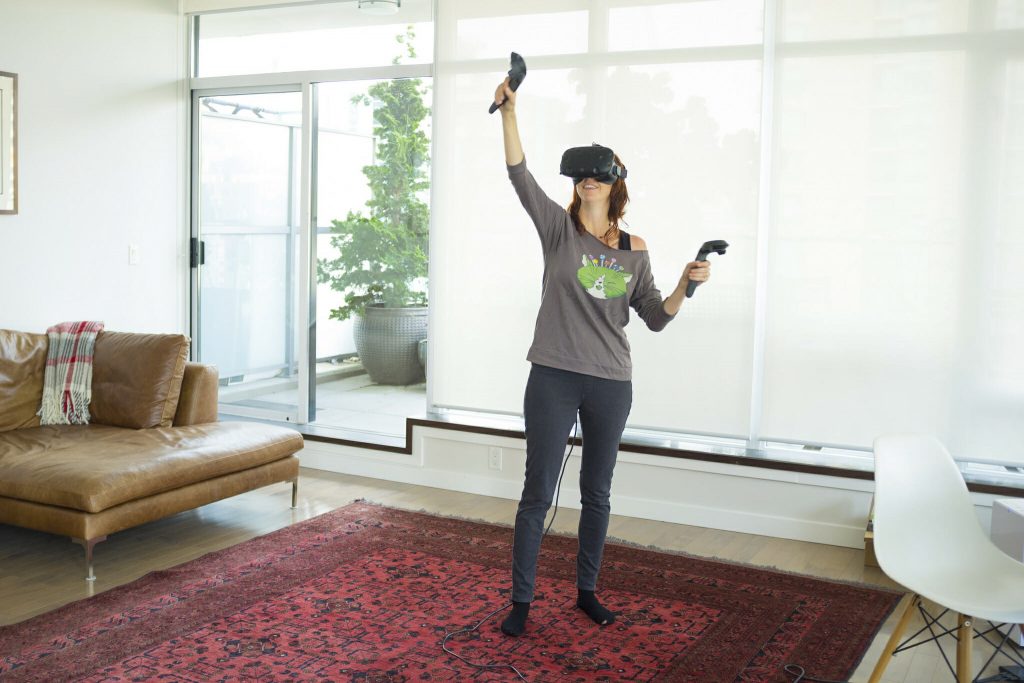
Virtual reality (VR) is a computer-generated model of experiencing in which, although the surrounding is not real in the technical sense, they appear to be so. Virtual reality can make a user feel as though they have been transported to another place, and the reason this can be helpful for data science is that it might allow the user to literally experience the data around them. Instead of looking at a boring graph or pie chart, a user’s experience of data becomes more interactive and memorable. Moreover, a 360-degree environment broadens the field available for representation and makes visualizing data simpler.
Integrating machine learning with VR can help various enterprises in a range of different ways. The total amount of data gathered doubles every single year, and of this, only one percent of the data is fully analyzed. Even with this minuscule amount of data being analyzed, the analysis is often rendered completely unhelpful, owing to the limits of visualization tools which can’t do a very good job of presenting complex information in a concise manner.
A lot of big enterprises are investing a lot of money in data science projects, but aren’t getting enough returns precisely for this reason. Let us say that a data science team reaches the conclusion that seven out of a possible 50 metrics will provide a certain favorable outcome. With the current technology, it is impossible to visualize all these seven metrics at the same time or to understand how they interact with each other, or how the absence of a certain metric impacts the remaining ones.
Seeing Data Differently
The advent of VR in data science is poised to change the way data is seen. Here are some ways in which that will happen:
1. More data visualization possibilities
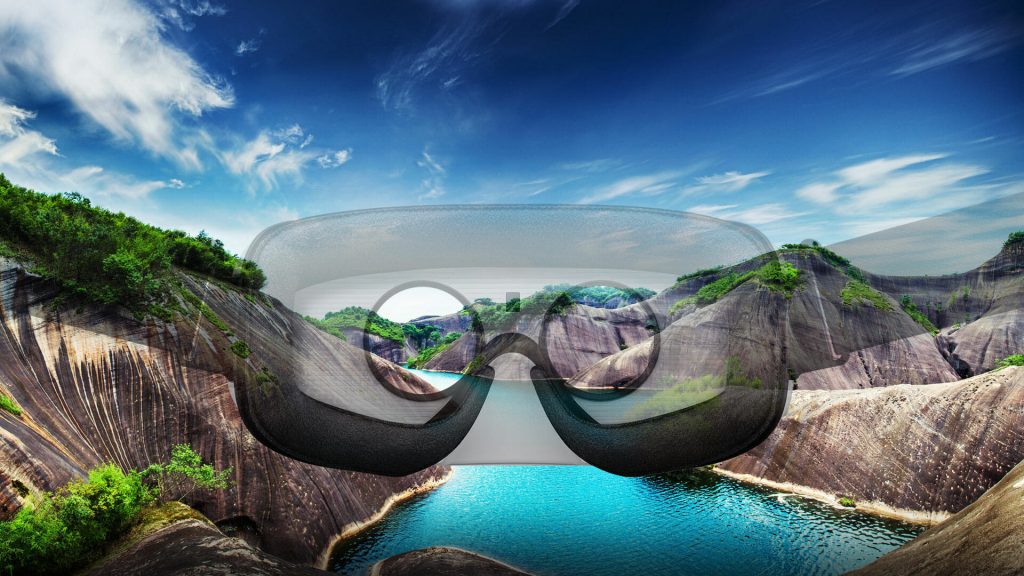
When data is presented on a 3D canvas instead of a 2D plane, it affects the way the data is received. When data wraps itself around the user, it can be understood differently as well. For instance, many more dimensions than the traditional placement coordinates (X,Y, and Z) become available, because they can be distinguished by color, size, transparency, or any number of variables set forth. Depending upon the kind of data visualized, it can even be classified according to direction or magnitude of a vector.
2. Intuitive approach
It is also of crucial importance to keep in mind that the way VR will present data is the way we interact with the world at large. Humans have evolved – over a period of several thousand years – to interact with the environment in an intuitive way. This is certainly one of the guiding posts when it comes to data visualization in VR, and is sure to change the way data is conceived in the first place.
3. Multiple users
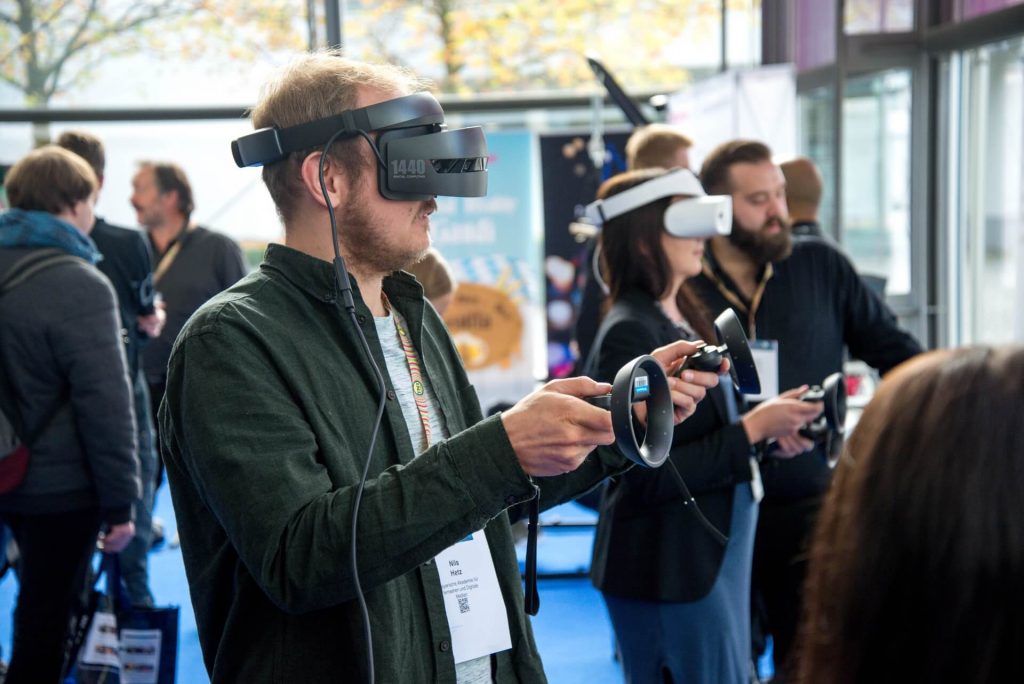
When data is presented in VR, multiple users can inhabit the environment at the same time. Contingent on the number of headsets available at a certain point in time, many people can visualize the data together, leading to more fruitful collaborative efforts without the requirement of any other technology. This makes the process of sieving through and drawing insights from data a simpler one.
4. Eliminating distractions
With a user tapped into data presented in VR, their visual and to some extent aural senses are completely governed by the VR environment. Due to this, they can focus on what matters – the data – without the potential risk of being distracted due to extraneous factors.
The change in data visualization is underway
VR-enable data visualization has already set off several industries-wide movements. Although VR was initially thought to be important within the entertainment industry, with the increasingly complicated nature of data acquired – and practically no ways to make sense of it – multiple businesses are now looking towards VR to understand their data better.
One example of a business using VR in visualization is Goodyear, the tire manufacturer. They created a simulation in which every aspect of their racing tires was examined, and these changes were correlated with their effects on changing variables (such as road surface or weather), with the results being calculated in real time!
Thus, data science is poised to grow manifold through its applications in the field of virtual reality. Don’t lose out on the opportunity to learn a valuable skill which will doubtless be helpful in the near future!